Colorado PERA is the pension system for public employees in Colorado. Like most public pension systems, the benefits members receive have changed over time, with newer members receiving less generous pension benefits when compared to more veteran members who have an earlier membership date. Many pensions refer to these different levels of benefits as tiers, based on the member’s membership date; PERA uses the slightly less helpful term of “HAS Tables“. “HAS” stands for “Highest Average Salary”, which is an important part of the benefit formula, but which table you are on is not related to your salary but rather is determined by your membership date, when you vested, and your retirement eligibility. The table you’re on then determines when you are eligible to retire and receive benefits, as well as how much those benefits are.
You can find out which HAS table you are on by looking at the chart, or by logging in to your PERA account. Many veteran teachers are on Table 2 (membership before 7/1/2005, vested before 1/1/2011, and were not eligible to retire as of 1/1/2011). All new members are on Table 9, and folks who joined between 7/1/2005 and 1/1/2020 are somewhere in between Table 2 and Table 9. Unfortunately, many PERA members don’t know which HAS Table they are on or, if they do, don’t really understand how to read the tables and interpret what the tables mean to them. This is a critical piece of retirement planning (really, financial planning) for PERA members, and even younger members who think retirement is very far away need to be aware of the specifics of their HAS Table if they are going to make the optimal financial decisions along the way.
We talk about this in the class and in the book, but despite my best efforts neither one of those is going to go viral anytime soon :-), and the presentations I’ve been doing to some school district groups reach only a small sliver of the employees. (My presentation to nurses and health clerks in Greeley School District a few days ago probably reached around 30 people; the district has more than 2,200 employees.) So I thought I would write a (very long) post that attempts to help folks understand not only which HAS Table they are on, but more importantly how to read, interpret and understand their HAS Table. Here goes.
Which HAS Table Am I On?
As mentioned above, you can pretty easily figure out which HAS Table you are on from visiting PERA’s website and checking out this page and/or logging into your PERA account where it will plainly display which HAS table you are on. Once you know which Table you are on, you can download the appropriate pdf from their website.
Benefit Formula
PERA’s benefit formula is the same no matter which HAS Table you are on.
Years of Service Credit x 2.5% x Highest Average Salary (HAS)
But there are several important nuances to understand about that formula.
- How your HAS is calculated
- Whether you qualify for a full service retirement benefit (in which case you get the full 2.5% per year), or an early retirement benefit (in which case the 2.5% per year is reduced).
- Which retirement option you take, Option 1, 2 or 3, with the formula giving you the Option 1 retirement amount and Options 2 and 3 (with survivor benefits) receiving a lower amount.
How is My HAS Calculated?
- If you were vested (earned five years of PERA service credit) prior to January 1, 2020, then your HAS is based on the average of your 3 highest “years” of salary.
- If you were not vested prior to January 1, 2020, then it’s the average of your 5 highest “years”.
While the term “years” is frequently used, it’s technically the 3 (or 5) highest consecutive 12-months of salary that is used. While that frequently corresponds to school years, it doesn’t have to. If you receive supplemental pay for something in April, for example, it’s possible that the 12 months from April to the following March might be a higher total than the typical July through June total.
It’s also important to remember that those 3 (or 5) 12-month periods do not have to be consecutive. PERA will look at all consecutive 12-month periods and pick the highest 3 (or 5). And they do not have to be your last 3 (or 5) years, although they frequently are.
There are also some additional details that can affect this. Here are just a few of them.
- Many school districts will pay out for unused sick leave when you retire. This is PERA-includable salary and will add one month of service credit and could affect your HAS if the payout amount is high enough.
- PERA has an 8% per year “cap” on salary increases during your HAS years. This is to prevent “spiking”, a practice where some employers would manipulate how employees are paid to backload compensation into the last 3 (or 5) years in order to artificially inflate the PERA pension benefit. The way this is calculated is that PERA uses a base “year” as the starting point (either your 4th highest “year” or your 6th), and then multiplies your salary in that year by 1.08. That amount is then the highest amount they will allow for your 3rd highest year salary (for folks with a 3-year HAS, 5th for a 5-year HAS). Then then repeat that calculation for your 2nd and 1st highest year (4th through 1st for 5-year HAS). If your salary exceeds that amount in any of those “years” it’s not a problem, but PERA will only use your salary up to the 8% cap in your benefit calculation. (Note that your 4th highest year can be out of chronological order with the other three highest years, but your 3 highest years are arranged in chronological order for the 8% cap calculation.)
- Some pre-tax deductions for Section 125 benefits such as health/dental/vision insurance premiums and FSA (health, limited purpose, dependent care) contributions also come out pre-PERA for PERA members with membership prior to July 1, 2019. Those folks want to make sure to stop those pre-tax deductions prior to their HAS years. Note that pre-tax deductions for things like 401ks, 403bs, 457bs, IRAs, HSAs do not come out pre-PERA so do not affect your HAS.
- In addition to earning service credit, many PERA members can also purchase service credit. While this doesn’t change your HAS, it does change the “years of service credit” number in the formula, so can greatly increase your benefit. (See this and this for much more information on this attractive option.)
How to Read, Interpret and Understand Your HAS Table
After you know your years of service and how to calculate your HAS, then you have to be able to really understand what your HAS table is telling you. I’m going to use some screenshots to try to help do that, starting with someone on HAS Table 2 and then comparing with someone on HAS Table 9. Again, you need to make sure you know and are looking at your specific HAS Table.
Here is a screenshot of a portion of HAS Table 2.
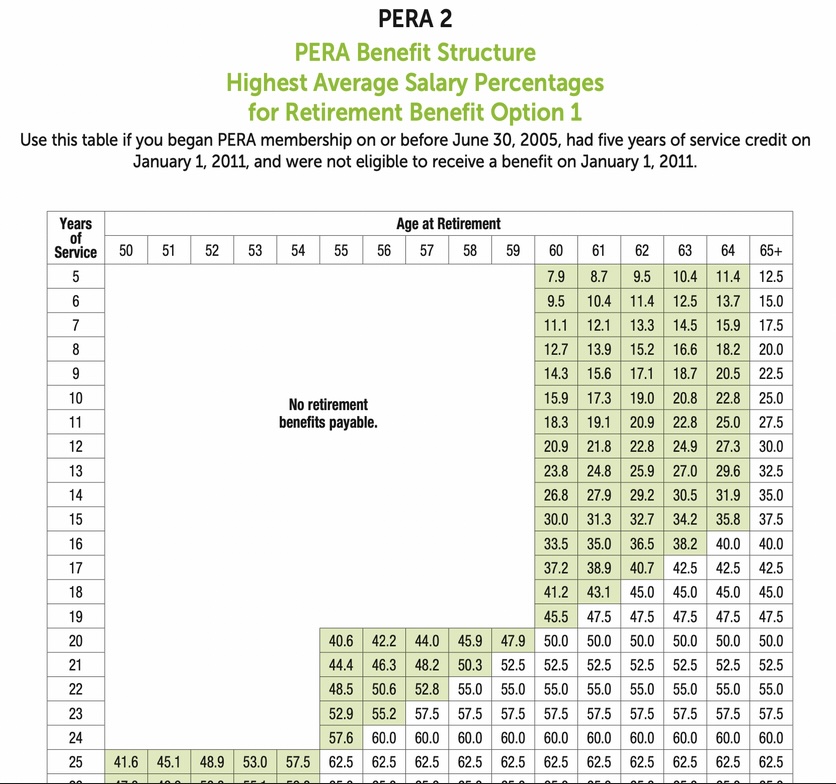
To orient yourself, across the top is your age at which you’d like to retire (or at least stop working for a PERA-covered employer), and along the left is your years of service credit (earned plus any you may have purchased). You then find the intersection of your age at retirement and years of service to determine your benefit.
If that intersection is in a blank white area, for example “age 55 and 18 years of service”, then you will not receive any benefit (yet).
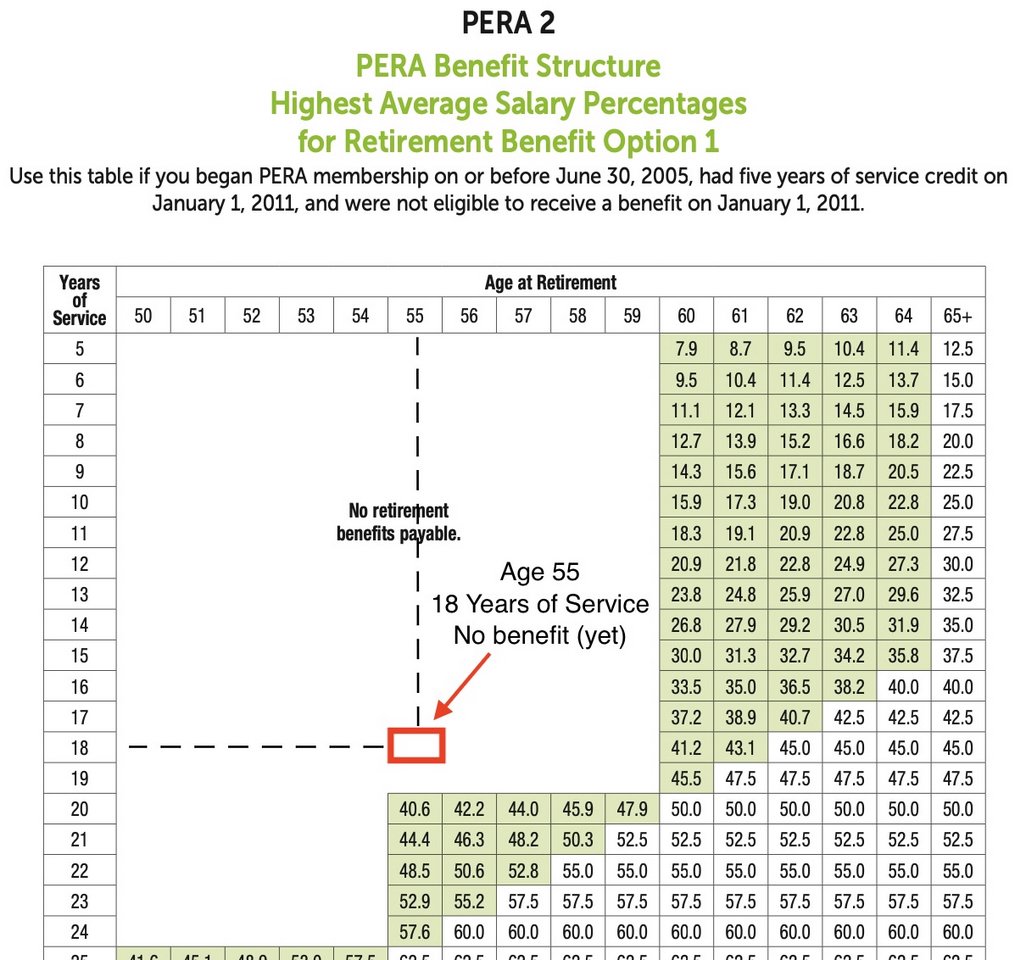
I say “yet”, because even if you retire at age 55 with 18 years of service credit, you will eventually “age in” to a benefit at age 60 (or later if you choose).

Once you reach age 60, you would receive 41.2% of your HAS as your benefit. The green shading behind the 41.2 indicates that this is considered an early retirement, so your benefit is reduced. You do not have to start taking your benefit at age 60. If you waited until 61, that percentage would increase to 43.1% (still reduced, but not by as much). If you waited until age 62, you will see that the 45% has a white background, which means it is considered a full retirement and you receive the full 2.5% per year of service (18 years x 2.5% is 45%).
If instead you were age 55 but had 20 years of service credit, the intersection would be as shown here.
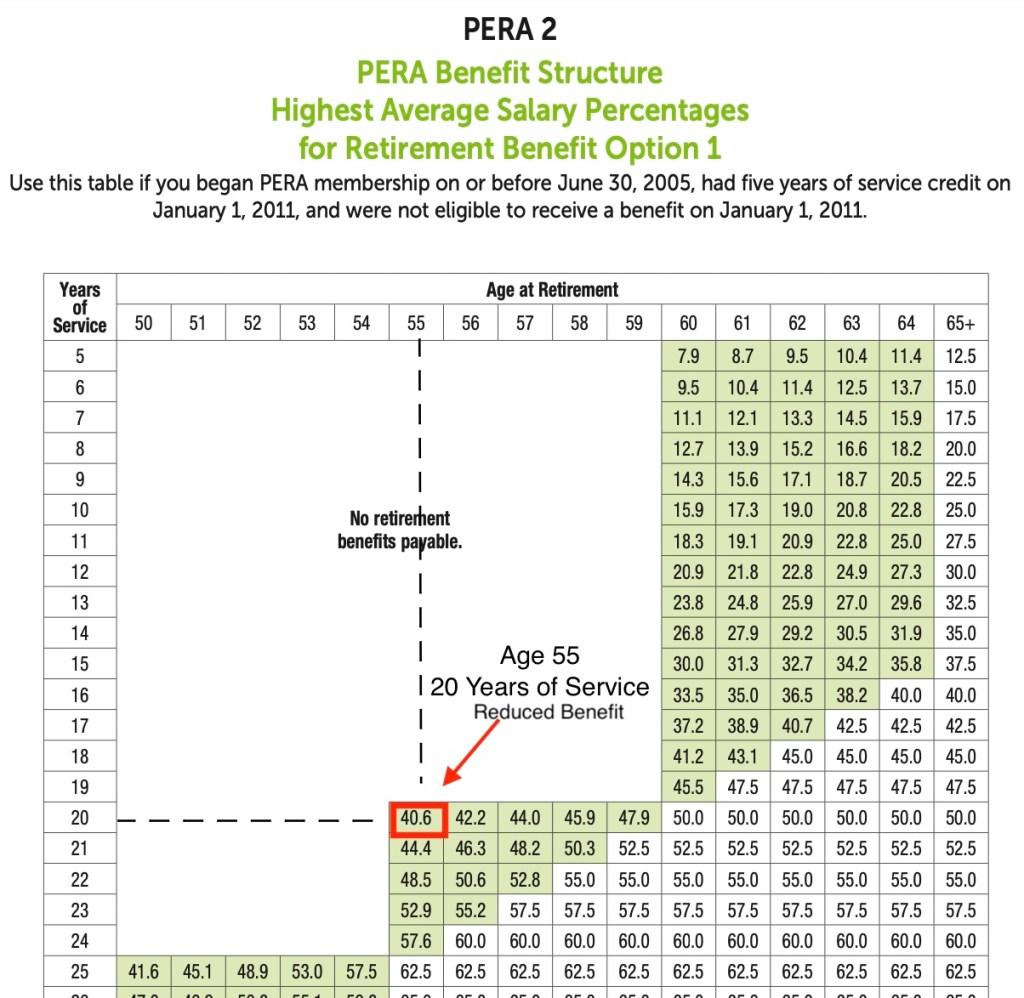
Here you would immediately start receiving a benefit (you would not have to “age in”) of 40.6% of your HAS. Again, you could choose to wait one or more years (and it’s actually calculated by months) in order to increase the percentage. There would be no advantage to waiting past age 60 to start drawing benefits because you would have reached the full retirement amount of 50% (20 years x 2.5%; waiting longer does not increase your percentage, so there would be no reason to wait).
If instead you were age 55 with 25 years of service credit, you would receive a full (unreduced) benefit, the full 2.5% per year of service credit for a total of 62.5% of your HAS.
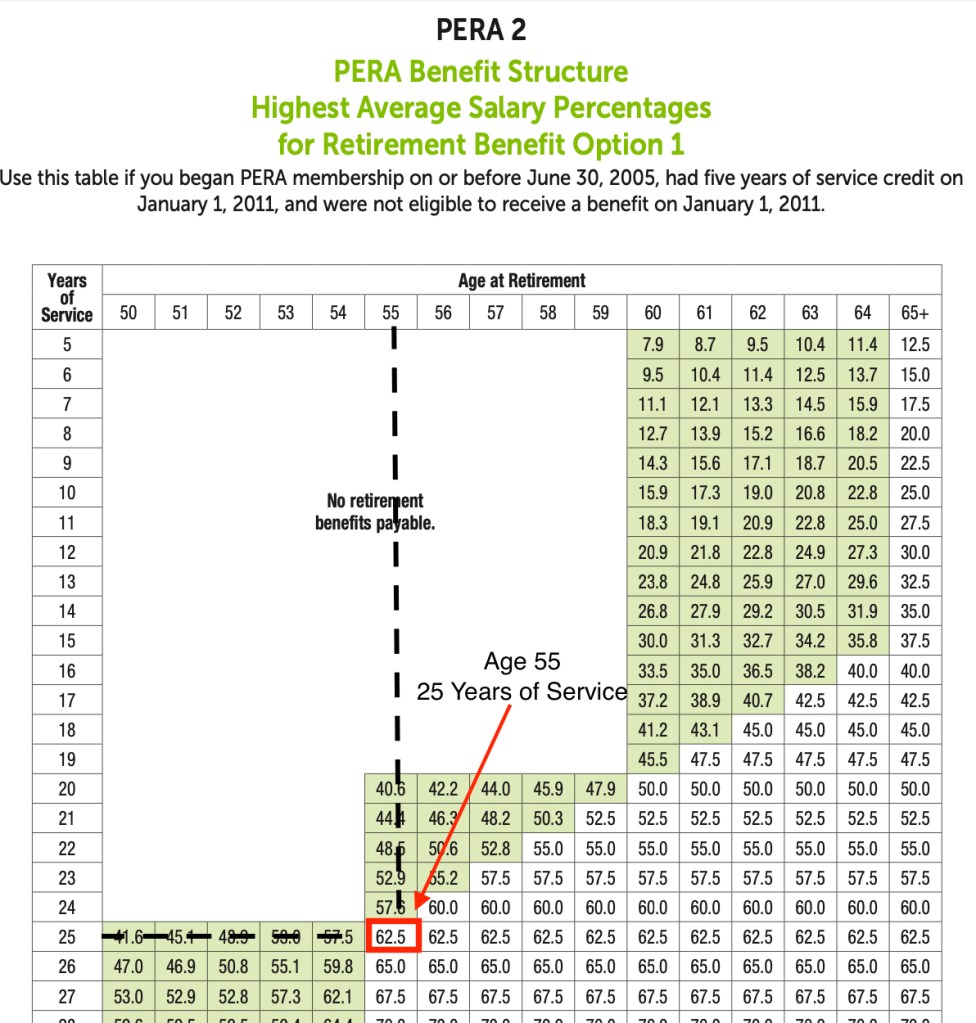
With each of these examples you can play the “what if” game by projecting diagonally down and to the right to see what one more year of working would look like. So if you are thinking about retiring at age 55 with 25, you would move down one cell and to the right one cell so see that if you worked one more year you would be at 56 and 26, which would give you 65% of your HAS. (Also realize that your HAS itself might increase a little by working that additional year.) You can continue moving diagonally year by year to see what additional years would accomplish.
Note that these are specific to Table 2, you need to look at your own HAS Table. For comparison, let’s look at Table 9.

Notice that for our example of age 55 and 20 years of service, which would’ve immediately received a 40.6% of HAS benefit under Table 2, receives no benefit under Table 9. They would have to wait 5 years to age in to a benefit, and even then the benefit would be a lower 31.8% of HAS.
And our example of 55 and 25, which received a full benefit of 62.5% of HAS under Table 2, would only receive a reduced benefit of 28.5% under Table 9. These effectively illustrate how benefits for newer PERA members are significantly less generous than for members on older HAS Tables. (Note that the formula is the same, it’s just that the combination of age and service credit considered to be a “normal”, “full” retirement is at higher ages and levels of service credit.)
Which Retirement Option?
As mentioned above, the formula (and the HAS Tables for early, reduced retirement percentages) are for the Option 1 Retirement. But you have three options to choose from at retirement that vary based on what benefit (if any) your surviving co-beneficiary will receive after you die.
- Option 1 (Single Life Annuity)
2.5% of HAS for each year of service (for normal, full retirement)
When you die, payments stop; nothing to beneficiary
(If you die soon after retiring, there may be a small lump sum to beneficiary) - Option 2 (Joint Life Annuity, 50%)
Lower benefit than Option 1
Reduction factor based on your age and age of your co-beneficiary.
When you die, your co-beneficiary receives 50% of your benefit.
If your co-beneficiary dies first, your benefit “pops up” to your Option 1 benefit. - Option 3 (Joint Life Annuity, 100%)
Lower benefit than Option 1 or Option 2
Reduction factor based on your age and age of your co-beneficiary.
When you die, your co-beneficiary receives 100% of your benefit.
If your co-beneficiary dies first, your benefit “pops up” to your Option 1 benefit.
For both Option 2 and 3, you take the percent of HAS from your HAS Table (for the intersection of age and years of service) and multiply by the reduction factor (which is based on your age and the age of your co-beneficiary). That factor is a fraction that is less than 1 (typically 0.9x or 0.8x), and the fraction is lower for Option 3 than for Option 2 (because your co-beneficiary gets 100% of your monthly pension benefit instead of 50% after you die). Note that for both Option 2 and 3, if your co-beneficiary predeceases you, then your benefit then immediately pops back up to the Option 1 amount for the remainder of your life.
So Now What?
Well, now you hopefully know which HAS table you are on and understand how to read and interpret it. Having this knowledge empowers you to make better financial decisions throughout your PERA-covered career (and beyond), and gives you realistic expectations of when you will be able to retire (or at least when you will qualify for a pension that you believe will be enough to retire on when combined with any other savings, investments, and/or partner retirement funds). It can also help you think about ways to optimize your HAS (be fully advanced on the salary schedule one year before your HAS years, stopping pre-tax Section 125 contributions one year before your HAS years if your PERA membership date is prior to July 1, 2019, making sure that if you have any large pay increases due to changing positions or big salary increase years that, if possible, you stay on long enough to not get limited by the 8% yearly cap, etc., or, ahem, you could even purchase the book to learn more about optimizing).
Your pension is a hugely important benefit. You need to fully understand it throughout your career, not just when you are about to retire. I hope this helps with that understanding.

Thank you! I feel like I understand this all pretty well but always get a few new nuances from your emails.
LikeLike
Glad you found it helpful!
LikeLike