One of the most talked about – and often least understood – aspects of any pension plan is its “funded status,” the percent of future liabilities that is currently funded (or, actually, projected to be funded) by current assets. This is certainly true of Colorado PERA, which will be the focus of this post. By necessity, this involves many, many assumptions, so will never be perfect, but the actuaries do their best to make the best projections possible, and PERA’s Board of Trustees does its best to make recommendations to the state legislature based on those projections.
Side Note and Pet Peeve: PERA administers the plan, but the state legislature funds the plan and determines benefits. Often people blame “PERA” when they really should be directing their ire toward the state legislature and governor.
Now, there’s no way in a blog post to dive into all of the complexities of PERA’s funded status (it is very, very complex), but I’m going to try to do a high level overview (which is still going to be very lengthy) that will hopefully help any PERA members and stakeholders1 who read this have a slightly better understanding of what’s going on. To do that, I’m going to refer to the Signal Light Report (latest report pdf) which is generated each year and the Automatic Adjustment Provision (AAP) (video, pdf). PERA maintains five different defined-benefit trust funds (State Division, School Division, Local Government Division, Judicial Division, and Denver Public Schools Division) as well as two retiree health care subsidy plans (Health Care Trust Fund and DPS Health Care Trust Fund). To simplify this a bit, I’m just going to use the School Division2 as an example, but everything I’ll talk about broadly applies to all the different trust funds.
PERA’s funded status is determined each year using the assets and liabilities as of December 31st of that year (not audited and finalized until the following June). The funded status is usually stated as just one number for the entire plan, but in reality each of those seven trusts funds has their own individual funded status. Because the school and state divisions are by far the largest (52% and 30%, respectively), they have the most overall impact on the total plan’s funded status. If you look at the 2021 Annual Comprehensive Financial Report (pdf), you’ll find that the overall funded status was 67.8% as of December 1, 2021 (School Division 65.3%, State Division 64.0%). But how do they come up with those numbers?
Well, like I said, it’s very, very complicated and involve many, many factors. A few of the factors (these are not all of the factors) that are easiest to understand are:
- Current Value of Assets (this is the only factor that is known exactly, although even this one has some estimates in it in terms of the value of real estate, alternatives and private equity, which are not marked-to-market).
- Assumption about the long-term rate of return that PERA’s investment portfolio will achieve (current assumption is 7.25%)
- Assumption about the growth in the number of employees (for example, the current assumption for the School Division is that the number of active employees will grow by 1% per year).
- Assumption about the average wage growth (currently 3%).
- Assumption about how long each employee will work, when they will start drawing a benefit, which retirement option they will take, and when they (and their co-beneficiary where applicable) die. (Note: They do this calculation for every single member of PERA!)
- Assumption on what the future cost-of-living increases for retirees will be (currently 1% starting 3 years after you retire).
Again, these are not all the factors, but gives you some idea of the complexity of this calculation. Some folks may be surprised that the assumed rate of inflation is not one of these factors, and it’s not, but it does factor into many of them (wage increase, rate of return, etc.). When the actuaries crunch all the numbers based on the assets and liabilities as of December 31st each year, they come up with a funding ratio for each division and then an overall funding ratio.
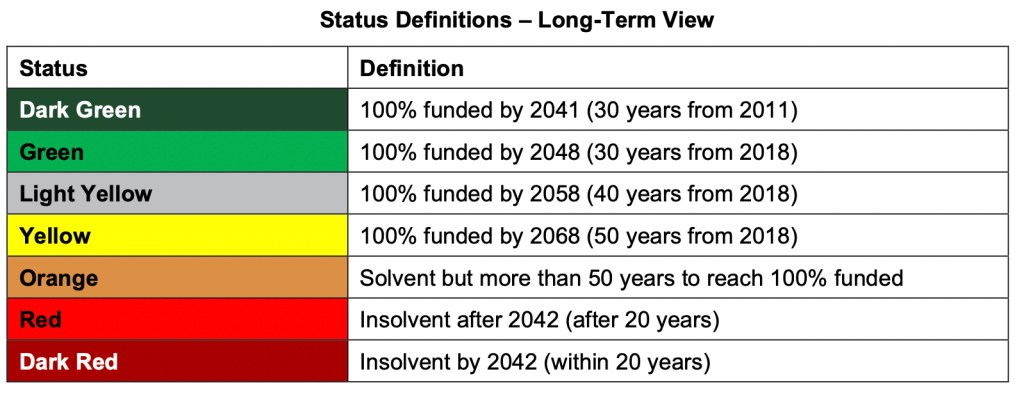
They then also use those numbers to project how many years it will be for each division until “full funding”, meaning the division will be 100% funded (assets will exactly match liabilities). As of December 31st, 2021, the School Division was projected (if every single assumption was exactly correct) to be fully funded in 16 years (so around 2037). But, of course, assumptions are never exactly correct, so they also do some stochastic modeling and assign probabilities to different outcomes based on possible variations in those assumptions. They then use those probabilities to assign a “color” to each division, ranging from Dark Green to Dark Red, of the likelihood of reaching certain benchmarks at certain times.
Each division is then assigned a color. Here are the status of the various divisions as of the December 31, 2021 valuation.
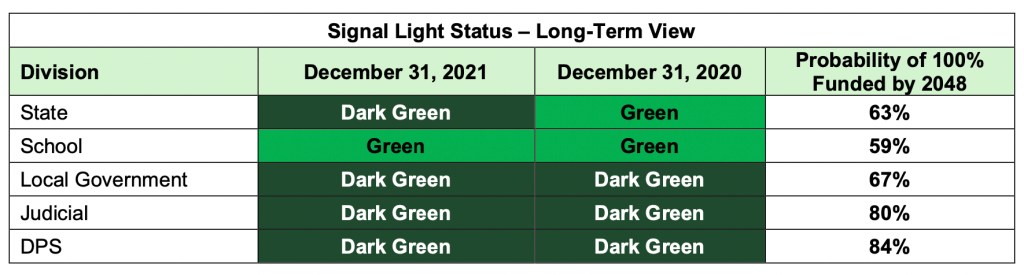
This is great for what it is, but it also ends up being confusing to a lot of folks for several reasons. For example, the current funding percent (67.8% overall) doesn’t seem that great, yet four of the five divisions are “dark green” and the fifth is “green” (and pretty close to dark green). And from year to year, the colors can sometimes change by several “levels” which can be “shocking” to some folks and makes them not very confident in the accuracy of the results or in the process. It can also result in the triggering of the AAP despite the funding ratio going up year over year and the colors all being good.
The reason for this is actually pretty straightforward: it’s the difference between long-term and short-term. PERA makes assumptions looking thirty years out (and, actually, longer than that), and while a lot can change in thirty years, we at least have a historical record to look at to help us make assumptions. But short-term changes can be very volatile, and can have outsized effects on whether the projection will meet PERA’s mandate of a closed thirty-year amortization (or, more accurately, still be on pace to meet the closed thirty-year amortization).
What’s a “closed 30-year amortization?” Historically, most pension plans were amortized over an open 30-year period, meaning each year the pension would be evaluated on the likelihood that it would have adequate assets to fund payouts and how well it was funded compared to liabilities looking thirty years out. It was “open”, because each year the 30 years was measured from the current year, not the previous year. This makes a lot of sense because pensions aren’t designed to “end,” but instead are designed to continue on in perpetuity, so there’s no particular reason to set an artificial (and arbitrary) deadline of a specific year they needed to be fully funded by, as long as they can continue to pay benefits.
But as folks became more and more concerned about pension plans (and the politics ramped up), many started arguing for a “closed” thirty-year amortization, meaning that the “end point” for the amortization was a fixed year in the future, so that each year you were actually amortizing only over the remaining time period. (So, when you start you amortize over 30 years, the next year over 29, the next over 28, etc.). In 2018 the Colorado General Assembly passed and the Governor signed Senate Bill 18-200, which changed PERA to a closed thirty-year amortization period and included the Automatic Adjustment Provision (AAP). This provision was designed to “automatically” adjust certain factors if PERA’s projected funding period was either behind or ahead of the goal (all divisions fully funded by 2048, 30 years from 2018). If at any year-end PERA was lower than 98% of where they should be to meet the closed thirty-year amortization, the AAP would kick in, resulting in increased contributions by both employer and employee (with a cap), a reduction in the Annual Increase for retirees (with a minimum of 0.5%), and an increase in the state direct distribution (although, ahem, this is capped at $225 million and can’t go higher). If instead they exceed 120% of where they need to be, the AAP kicks in and adjusts the opposite direction (so lower contributions from employers and employees), an increased Annual Increase (up to a maximum of 2%), and a decrease in the state direct contribution. The goal is not to get to full funding as quickly as possible, but to get there reasonably gradually by 2048. (We can get there “quicker” by making more drastic changes, but then would have equally drastic corrections down the road. The thinking is that is better – and fairer for everyone – to smooth it out over the full 30 years. That’s why the AAP can adjust either way to “smooth the ride.”)
Because of the complex interplay of all the factors, this can cause some cognitive dissonance. For example, 2020 was a great year for investing, and PERA earned 17.4% on its investments (well over the assumed 7.25% return), yet the AAP was still triggered. This was because PERA performed an experience study, which looked at past experience and changed some assumptions, as well as adopting new mortality tables that reflected increased life expectancy (and, for the first time, incorporated data specifically for public employees’ life expectancy, which is longer than the average life expectancy). These demographic and mortality changes made enough of a difference that despite the excellent return from investments, the AAP was triggered, resulting in a 0.5% increase in contributions from both employers and employees and a 0.25% reduction in the Annual Increase for retirees.
This is part of the “shared sacrifice” design of PERA reforms, where employers, active employees, and retirees all have “skin in the game” and contribute toward paying off the unfunded liability. The 0.5% from employers and employees and the 0.25% from retirees is designed to be “roughly” equivalent in terms of impact. The reality is, of course, that retirees do not have as many levers to pull as employers or active employees, so it can have a more dramatic impact on retirees.
Then 2021 was another great year for investments (16.1%) which increased the funding ratio, yet not enough to trigger the AAP the other direction. Because the AAP is triggered at 98% on the downside and 120% on the upside, it’s much more difficult to trigger it the other direction. The Signal Light Report then tries to make projections based on current assumptions, as well as the probability of different outcomes. They also do some “stress testing” to see what might trigger the AAP to try to overcome some of that cognitive dissonance.
For example, if any one of these conditions were to be met in 2022 (the other two meeting assumptions), the December 31, 2022 valuation would trigger the AAP.
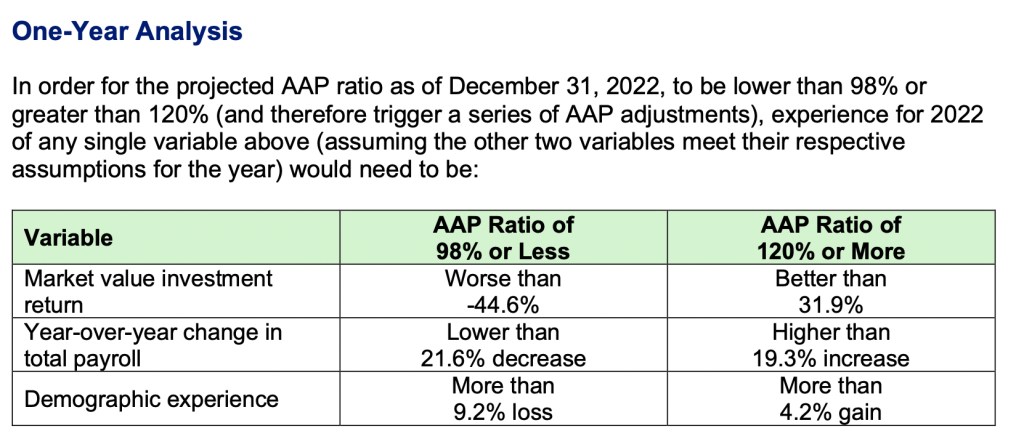
This is particularly helpful because, as you are probably aware, 2022 has not been a fantastic investing year so far, making it unlikely that PERA will achieve the assumed 7.25% return this year. We still have a little over three months left in the year, so we don’t know what the final result will be, but given the result so far this year it’s reasonably safe to assume that the year will end with a fairly significant loss for PERA’s investments. If you use the public market benchmarks to match PERA’s roughly 70%/30% split between equities and fixed income, a portfolio like PERA’s would be down about 20% so far this year. PERA may outperform (or underperform) that, but probably by not more than ±2%.
But as you can see above, this one year of poor returns won’t (by itself) cause the AAP to kick in (it would need to be close to -45%). This is partially due to another factor, which is that investment gains and losses are “smoothed” over four years, which means the investment gains of the last few years are still being realized (actuarially) over the next few years, and the potential losses from this year will also be spread out over four years. But that doesn’t mean everything is rosy, because a loss of 20% (for example) will have a large impact on PERA’s funding status, stretching out the years to full funding and making the AAP in a future year more likely. Because PERA is climbing out of an unfunded liability “hole”, their sequence of returns matters.
Just to be perfectly clear here, PERA has an unfunded liability because the state legislature has underfunded it, not because of anything “PERA” or “PERA Members” have done. In 2000, PERA was 103% funded. In their infinite wisdom, the state legislature (Dem) and governor (GOP) cut contributions, increased benefits, and held a fire sale on purchasing service credit. Then the dot com crash happened, followed a few years later by the Great Financial Crisis, and we’ve been playing catch-up ever since.
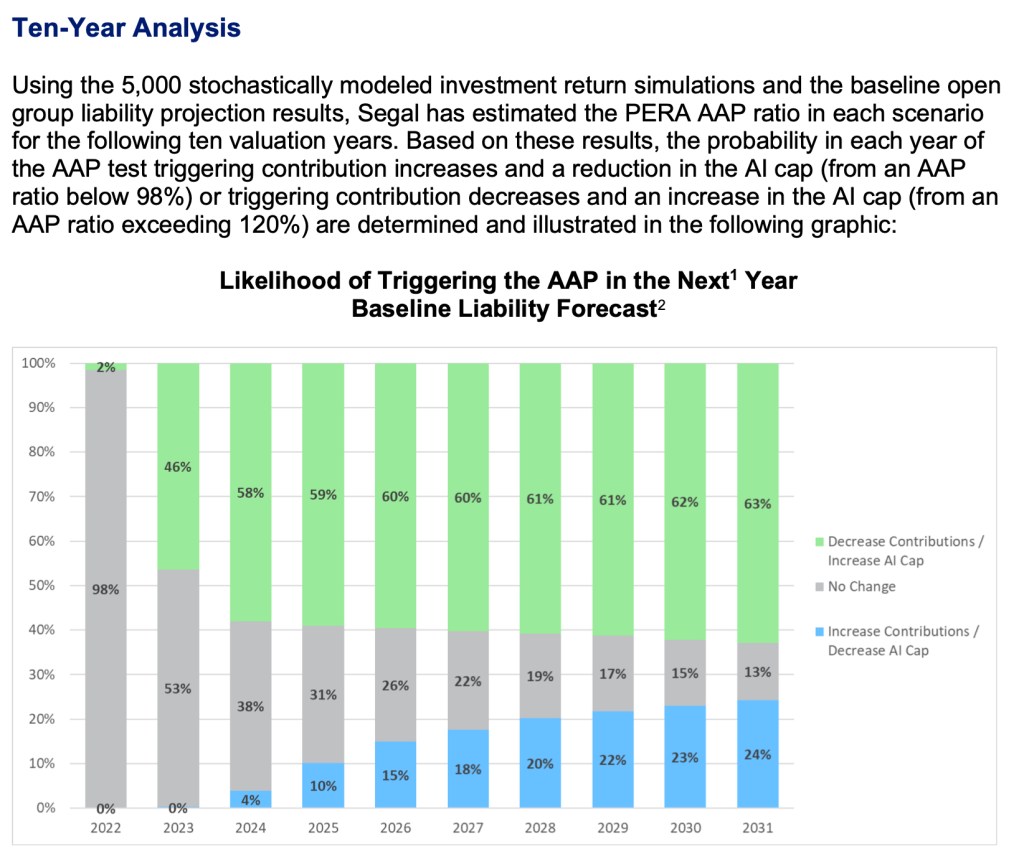
For example, in the Signal Light Report they looked at what might happen if the rate of return in 2022 was -5.75% ( a 5.75% loss, which is one standard deviation to the downside of the assumed rate of return), and then the assumed 7.25% each year after that.
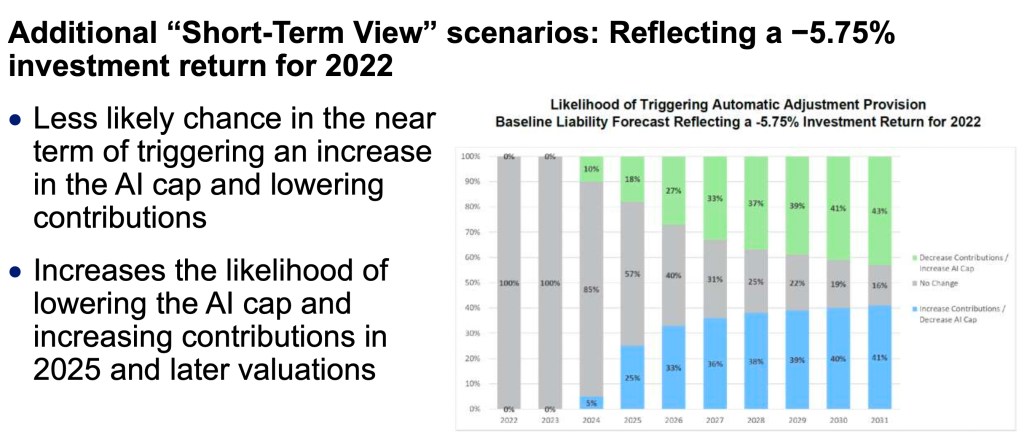
As you can see, while not a good thing, it doesn’t have much impact on the short-term likelihood of the AAP kicking in. They also included scenarios where payroll growth was flat (or higher) or if the assumed long-term investment return was lower (7% or 6.75% for the duration), just as illustrations of how things could change. For comparison, here’s the baseline liability forecast for the next 10 years.
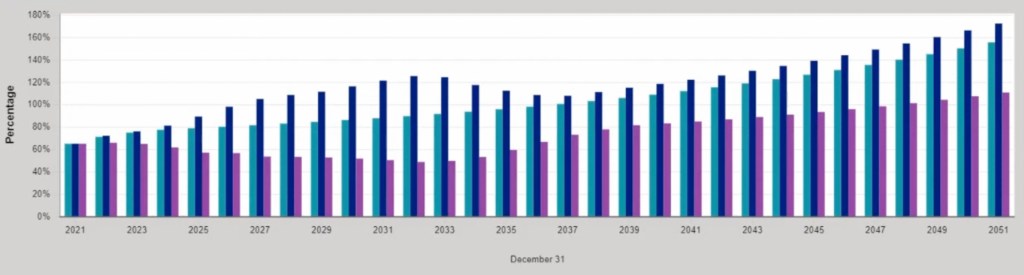
But, of course, they couldn’t include every possibility, so they didn’t include a -20% return possibility. (This kind of year is definitely an outlier, both due to the extent of the drop in equities, but also that fixed income is dramatically down as well – typically bonds would provide some ballast.) But during the September Planning Session, they did use the modeling to take a look at what funding projections looked like with either a -10% or a -15% return in 2022. (Note that this is specific to the School Division, but the impact to all divisions would be directionally similar.)

The taller teal-colored bar is the assumed 7.25% return, the dark blue bar is assuming a 10% loss in 2022, and the purple bar is assuming a 15% loss in 2022 (all assumptions assume 7.25% in subsequent years). You can see that it has a fairly dramatic effect and extends the full funding period dramatically. With a 15% loss, reaching 100% funding is extended from 2038 to sometime after 2051 (the graph doesn’t quite get far enough for this scenario to reach 100%, but I would suspect it would be in the late 2050s).
They then modeled a 15% loss in 2022 followed by a 0% gain (or loss if you prefer) in 2023, then 7.25% thereafter.

They also modeled changing other assumptions, like payroll growth, wage increases, etc., but the rate of return one is the most visceral one. Interestingly, they also nicely demonstrated sequence-of-return risk by looking at three different scenarios where PERA earned a geometric return of 7.25% over the next 15 years, but in three different sequences. First, a straight 7.25% each year, then a strong first 10 years and a poor last 5, then a poor first 10 years and a strong last 5.
- Teal = 7.25% every year
- Blue = Strong first 10 years, then poor last 5
- Purple = Poor first 10 years, then strong last 5
Wow. Again, all three scenarios “average” 7.25% over the 15 years, but the sequence really, really matters.
An important thing to keep in mind, however, is that these models only change the variable(s) indicated, and don’t assume any other changes are made on the funding or benefits side. For example, both of the loss examples would likely result in the AAP kicking in two to four years down the road, which would then elevate those blue and purple bars. And, if things go so very badly that the AAP can’t compensate enough, the assumption is that the legislature would then step in with additional adjustments. (In other words, they/we wouldn’t just let the funding fall off of a cliff.)
So the bottom line is..it’s complicated :-). Over a long period of time (say the next 30 years, or the 25 or so remaining until the closed thirty-year amortization is up), variations do tend to smooth out and the outlook for PERA is good. But over a short period of time, a really bad (or really good) year or two can have dramatic downstream effects that can cause the AAP to kick in, even if the long-term picture is still pretty good (if not as good as before). And, crucially, due to sequence of return risk, the next ten or so years of return are really, really important. That means that while a really down year this year is bad, a series of down (or under-performing the assumptions) years (or another “lost decade” of returns) would be much more serious.
With PERA’s recent experience study and adopting new mortality tables, that portion of the assumptions is much more likely to be pretty accurate for the next 5-10 years. But actual return on investment, payroll and wage growth, and other factors (for example, the legislature passing legislation that adds to the liability but doesn’t provide any funding for it) can still have large enough effects to trigger the AAP and/or cause the politics to get revved up around making other changes. Just like no one can predict what the market will do, no one can predict how PERA’s funding status will change or when the AAP will kick in (modeling possibilities is different than predicting). If I had to guess (and it’s only a guess), I would guess that there’s a decent chance (more than 30%) that the December 31st, 2023 valuation might trigger the AAP (the bad way), which would take effect July 1, 2025. But, just like the markets rebounded amazingly fast after the Covid-inspired March 2020 drop, that could happen again before the end of 2022 or 2023, which would alleviate the AAP risk (at least in the short-term).
I still feel very confident and comfortable with PERA’s long-term funding status and feel like policies (like the AAP) are in place to keep us on track under reasonably normal economic and demographic scenarios. But I would definitely feel better if the legislature showed more of an appetite for fully funding PERA and not hoping that PERA’s investment returns will bail them out from having to make unpopular decisions. (For example, “simply” repealing TABOR and using a portion of the excess revenue the state could keep from existing taxes to shore up PERA would go a long way to reaching full funding much, much sooner. Which, of course, would be a long-term benefit for Colorado taxpayers.)
So hopefully this is helpful (and not too overwhelming). But, if you have questions, feel free to leave a comment or contact me directly and I’ll do my best to try to answer them. In the meantime, any time someone makes a simple statement about PERA and it’s funding status, try to keep in mind that it’s anything but simple. And no matter which way they are trying to spin it, if they say anything with a high amount of certainty, be very, very skeptical.
1 Obviously PERA members are a huge stakeholder, but really every Coloradan is a stakeholder in PERA because of the huge impact public employees have on our everyday life, as well as the impact PERA benefits have on the economy. And even folks outside of Colorado are impacted, as PERA retirees don’t just stay in Colorado and all of the economy is interconnected.
2 The School Division is the largest PERA division, comprising just over 50% of PERA as a whole, with the State Division also being very large at around 30%. Plus, most folks reading this are going to be in the School Division, so it’s the most relevant, and clearly we are the most important :-).

Why can’t the legislature help address the deficit with monies to address the underfunding? With the governor’s background (politically) in education, he should see the importance of bringing COPERA back to stability.
LikeLike
For the same reason they underfunded it in the first place – money. They only have so much money and lots of different places to spend it. As long as PERA stays on track for full funding by the 2040s, they are okay with it.
LikeLike