Many school districts have a salary schedule for teachers where your pay increases based on a combination of the number of years you have taught in the district (“steps”) and the educational level you attain (“lanes”). While steps are automatic (well, except for the occasional bad budget year where steps are frozen), lanes are dependent on whether teachers get additional education (and how much they get). Most teachers are aware that if they get additional education and move across the lanes they can increase their salary, but many may not know the huge difference that can make over time (and how important it is to move over those lanes as quickly as possible). So even though veteran teachers always tell younger teachers this, I thought being able to show them the difference instead of just telling them might be helpful.
I’ve created a spreadsheet that uses a fairly typical local school district‘s salary schedule to illustrate. There are three tabs on the spreadsheet and it’s important to look at each of them:
- Steps & Lanes Cumulative Salary
- Steps & Lanes Effect on Pension
- Steps & Lanes Invest Half Your Raises
Note: You can choose File–>Make a Copy to get an editable version of the spreadsheet, and then fill in your district’s salary schedule. Input the existing salary schedule as is, don’t inflate future year salaries. That way everything will remain in today’s dollars.
Some notes to help you interpret/use the spreadsheet:
- The entire spreadsheet is in today’s dollars. While salaries will increase in the future, so will inflation. So the numbers in the spreadsheet aren’t inflated and therefore reflect today’s purchasing power (which is easier to put in context than future inflated dollars).
- It’s unlikely anyone will spend their entire teaching career in one lane, so while the column totals are still very meaningful, they also will not match anyone’s actual salary path.
- Getting those additional hours is generally not free (especially getting a Master’s degree), so there is some cost associated with moving horizontally across lanes (but some of that cost is unavoidable, as you have to get recertification hours).
- The pension tab is for Colorado’s pension system and is assuming a 5-year Highest Average Salary (HAS) which applies to members who were not vested (5 years of service) prior to January 1st, 2020. For those who were vested by then, it’s a 3-year HAS.) It also calculates the Option 1 retirement option (members who choose Option 2 or 3 will have a lower amount, but it will still be proportional to the numbers in the spreadsheet).
- The Invest Half Your Raises tab assumes you save half of your raise each year and then invest it. In future years you continue to save and invest what you did before as well as half of that year’s increase (if there is an increase). The assumed rate of return on investment is 7% (cell U2), but you can modify that if you’d like. It also assumes no return on the additional savings you add each year during the first year you add those additional savings (so just investment gains on the previous years’ savings and investment growth).
It’s worth taking some time to explore all three tabs of the spreadsheet, but here are some takeaways.
Cumulative Salary
After 30 years of teaching, you make about $750,000 more in the MA+45 lane versus the BA lane. After 35, it’s over $1 million. After 40, it’s over $1.2 million. (Probably the most appropriate lanes to compare are BA+30 and MA+45 because of the hard stop if you don’t get your Master’s degree. That difference after 40 is still $706,000.)

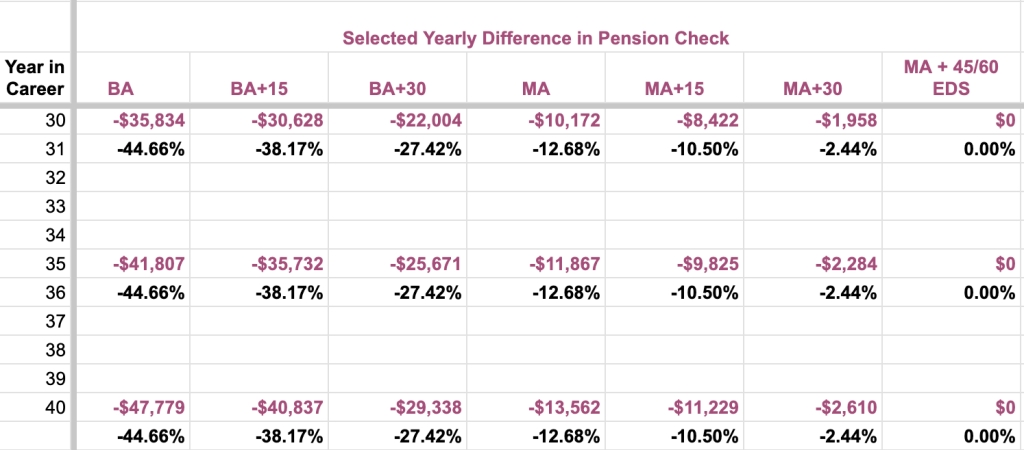
Difference In Your Pension
After 30 years of teaching, the difference in your annual pension is over $35,000 a year between the BA and MA+45 column (and $22,000/year between BA+30 and MA+45). After 35 years, it’s over $41,000 ($25,000). After 40 it’s over $47,000 ($29,000). Remember that this is how much more they will get each year for the rest of their life (which could easily be 30 or more years).
Invest Half Your Raises
After 30 years the difference in your accumulated investments is over $474,000 between BA and MA+45 ($202,000 between BA+30 and MA+45). After 35 it’s $781,000 ($353,000). After 40, it’s $1.2 million ($564,000).

And the cumulative investment total after 40 years – from simply investing half of your raise – is pretty astounding

Now, importantly, money isn’t everything. Really. So having the time, opportunity and energy to pursue these additional hours has to fit into your life circumstances, as well as what you value and want to do with your life. So please don’t feel “shamed” if you haven’t moved across lanes or if you choose not to. This has to be part of the “good life” that you want to live.
With that caveat in mind, hopefully this spreadsheet shows you the financial impact moving across lanes can have and that will hopefully help inform your decision making. When you combine all three impacts it will almost certainly be greater than a $1 million difference, and quite likely greater than $2 million or perhaps $3 million (depending on how long you live after retiring and continue to draw that much larger pension you’ll receive by maxing out your lanes.)
Does this information spur you to accelerate moving across lanes? Or do you feel like you have “enough” and your time and energy is better spent elsewhere? Feel free to leave a comment below or reach out with questions or suggestions.

5 thoughts on “Salary Schedule Lanes: Your Million Dollar (or two or three) Decision”